Native Debug : iOS and Android

Hi
I want to debug on device iOS and android. After following cococ document given
https://docs.cocos2d-x.org/creator/2.1/manual/en/publish/debug-jsb.html?q= , I tried to find cocos2d-x JSB on safari browser, but there is no such option fot ioS debugging. Similarly i tried to debug on chrome for android by using
“chrome-devtools://devtools/bundled/inspector.html?v8only=true&ws={ip}:5086/ 00010002-0003-4004-8005-000600070008” , but it always shows debugging connection was closed. reason websocket disconnected.

Please help me out for debugging, Provide simple steps if possoble.

Android debug need pc chrome below version 6.9.
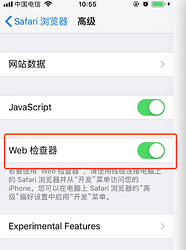
iOS debug need open phone safari option for remote debug:

@kenshin,
I am debugging with following system specifications
1: Machine : Mac
2: Chrome version : Version 71.0.3578.98 (Official Build) (64-bit)
3: Safari : Version 12.0.2 (14606.3.4)
4: Game running on Cocos Creator’s simulator

1-Which version of chrome is required on mac for android debugging ?
2- How to debug on creator’s simulator for android and iOS? I am not able to find any cocos2d -x JSB on safari browser on mac machine while running game on simulator (creator’s)?
3:While running on simulator i am also not able to debug for android

This is detailed in the documentation.
https://docs.cocos.com/creator/manual/en/publish/debug-jsb.html

@Kenshin
Thanks for reference,I tried to connect android device with chrome console using following steps mention in given reference as follows

Android Debugging
1 :Make sure that the Android device is on the same LAN as Windows or Mac.
2:Select the Android platform and Debug mode in the build publishing panel of Creator to build a compile-and-run project.
3:Open address with Chrome browser: chrome-devtools://devtools/bundled/inspector.html?v8only=true&ws={ip}:5086/ 00010002-0003-4004-8005-000600070008, where {IP} is the local IP of the Android device, you can debug it.

How we get android ip? i have connected My Mac and android device with same wifi (using mobile network and connecting PC with same mobile network by activating hotspot ).
-I think due to this process i will be on same network. - step 1 is complete.
-I have install app by using build process as mention - step 2 is complete.
-i have open given url () : chrome-devtools://devtools/bundled/inspector.html?v8only=true&ws={ip}:5086/ 00010002-0003-4004-8005-000600070008 by adding ip = ip from “whatismyip.com

still I am not able to debug on chrome. What is going wrong here? Every time i got message “debugging connection was closed websocket disconnected”.

use your android wifi ip address for below link example, 192.168.55.107 is my android wifi ip:
chrome-devtools://devtools/bundled/inspector.html?v8only=true&ws=192.168.55.107:6086/00010002-0003-4004-8005-000600070008

@Kenshin
It works now!! thanks … Port written in reference document is 5086 which need to be 6086.After connecting with port 6086 its working fine now.