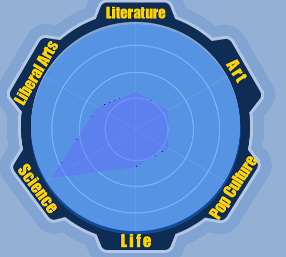
//雷达图(有锯齿)
drawRadarChart(sortArray,dataArray){
var drawDataArray=[100,100,100,100,100,100];//六边形半径
var mCenterX=pos.x;//中心点x,自己定义中心点
var mCenterY=posr.y;//中心点y
var mAngle = Math.PI * 2 / 6; //角度:Math.PI代表180°(不清楚的请百度),那么mAngle =60°,正好是六边形的夹角。
//算坐标,画图。canvas是左上角为原点,我这个是逆时针画法。
for(var i = 0; i < 6; i ++){
var x = mCenterX + Math.sin(mAngle * i)*drawDataArray[i]*1.5;
console.log(“sin+”+Math.sin(mAngle * i));
var y = -(mCenterY + Math.cos(mAngle * i)*drawDataArray[i]*1.5);//负号是因为需要镜像y坐标。
console.log(“cos+”+Math.cos(mAngle * i));
if(i==0){
this.graphics.moveTo(x, y);
}
else{
this.graphics.lineTo(x, y);
}
}
this.graphics.stroke();
this.graphics.lineWidth = 0.1;
this.graphics.strokeColor = cc.hexToColor(’#0000ff’);
this.graphics.strokeColor = cc.hexToColor(’#0000ff’);
this.graphics.fillColor =cc.color(100, 100,255,100);
this.graphics.fill();
},