
我猜是轮廓识别
先用mltb生成线稿,然后划区域,然后生成曲线,然后分配线头。
做个可拖拽曲线的编辑器,丢给策划,让他自己编,剩下的就不是你的事了!!
这个确实可以解决95%的问题,就是有点费策划,哈哈哈
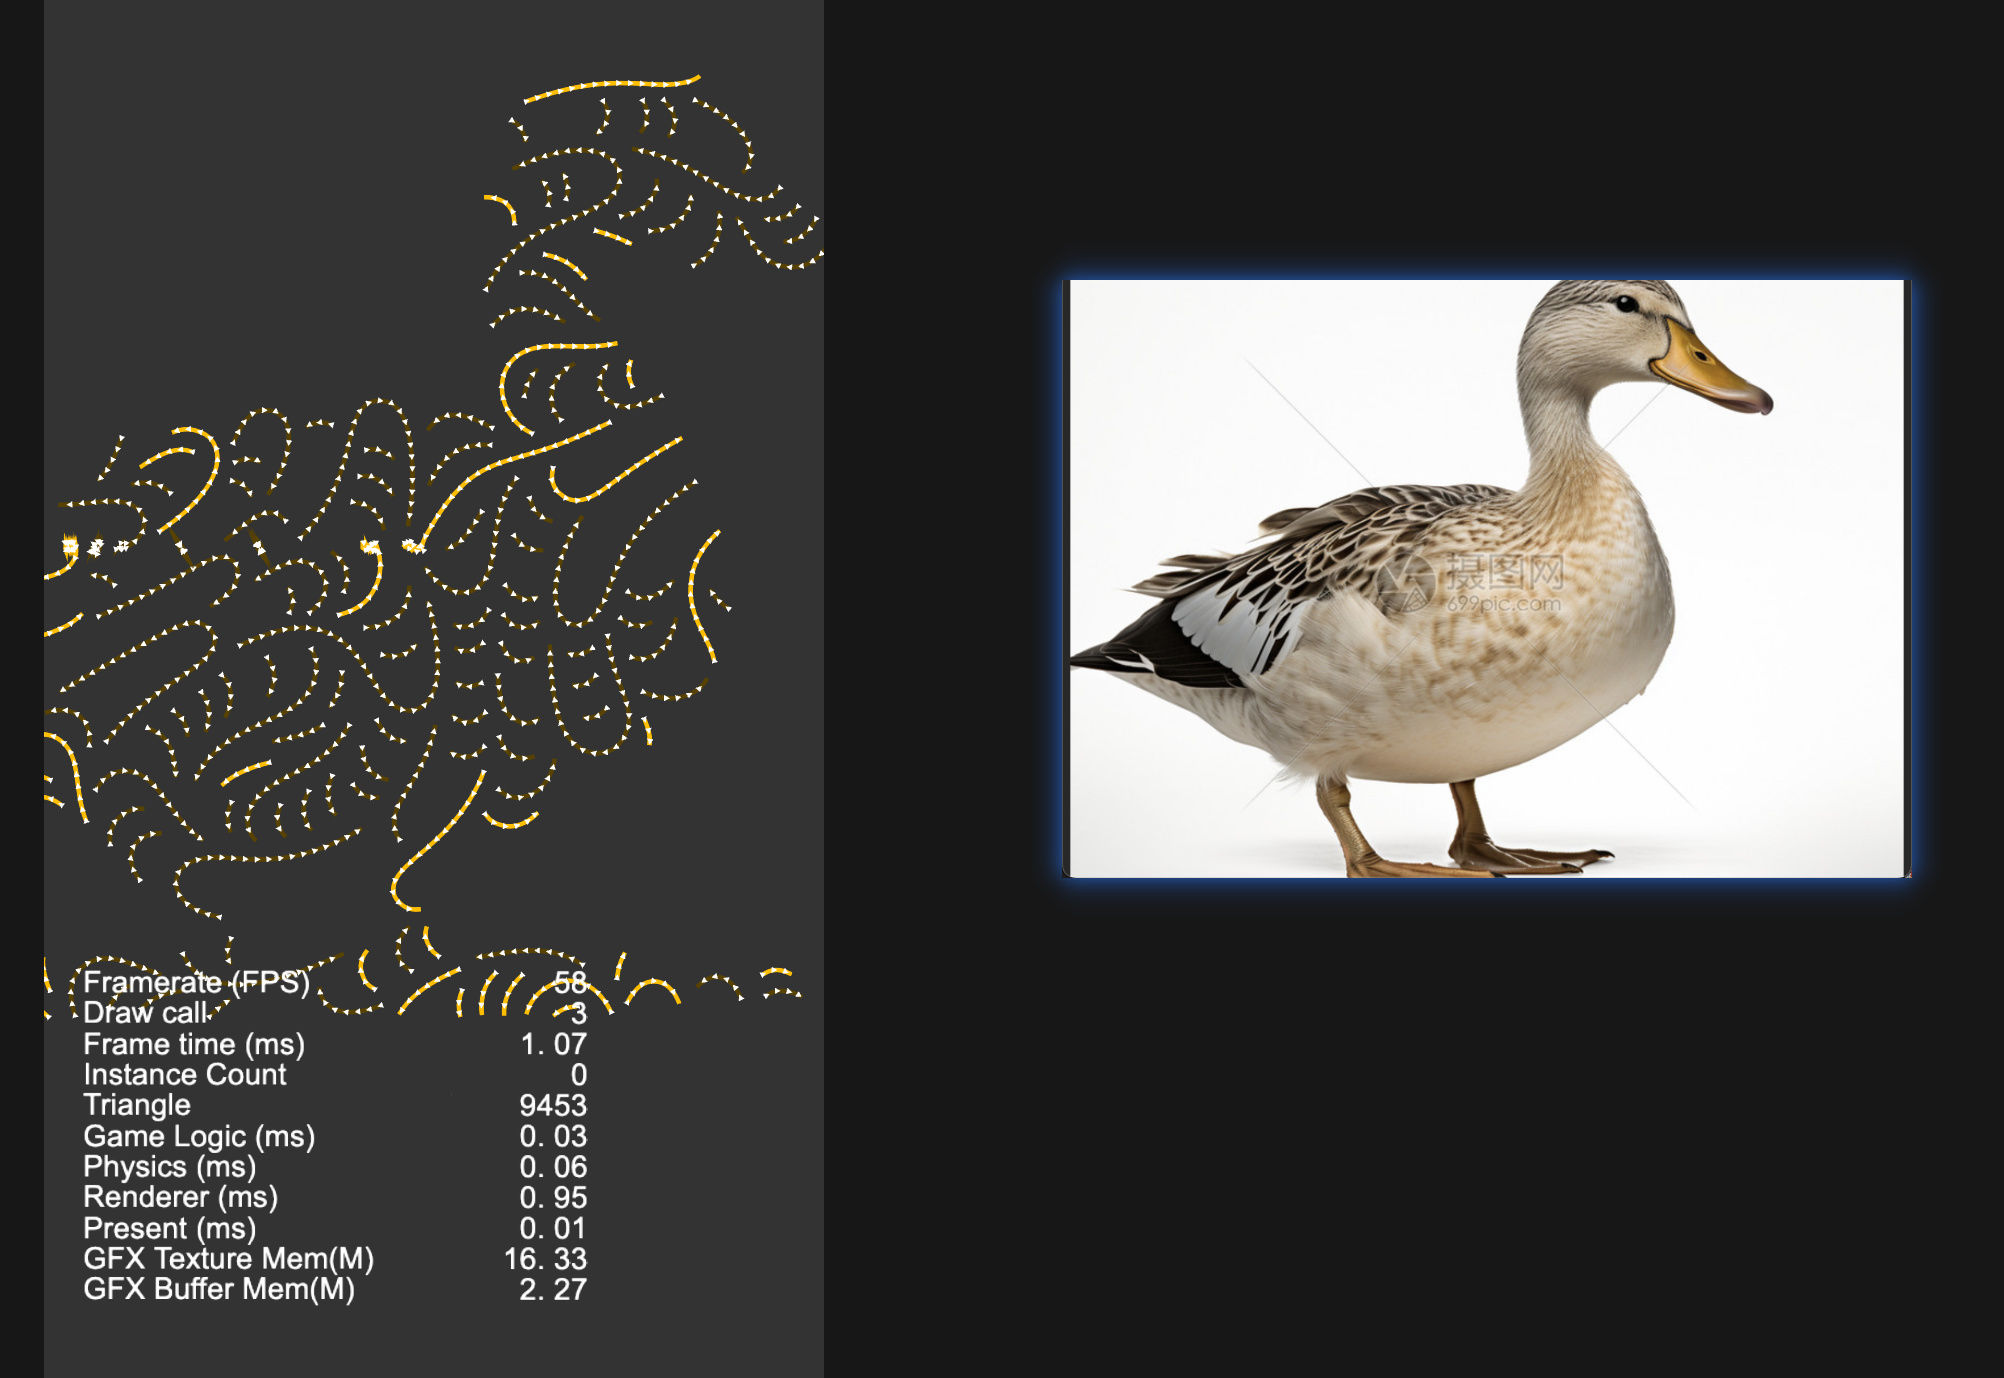
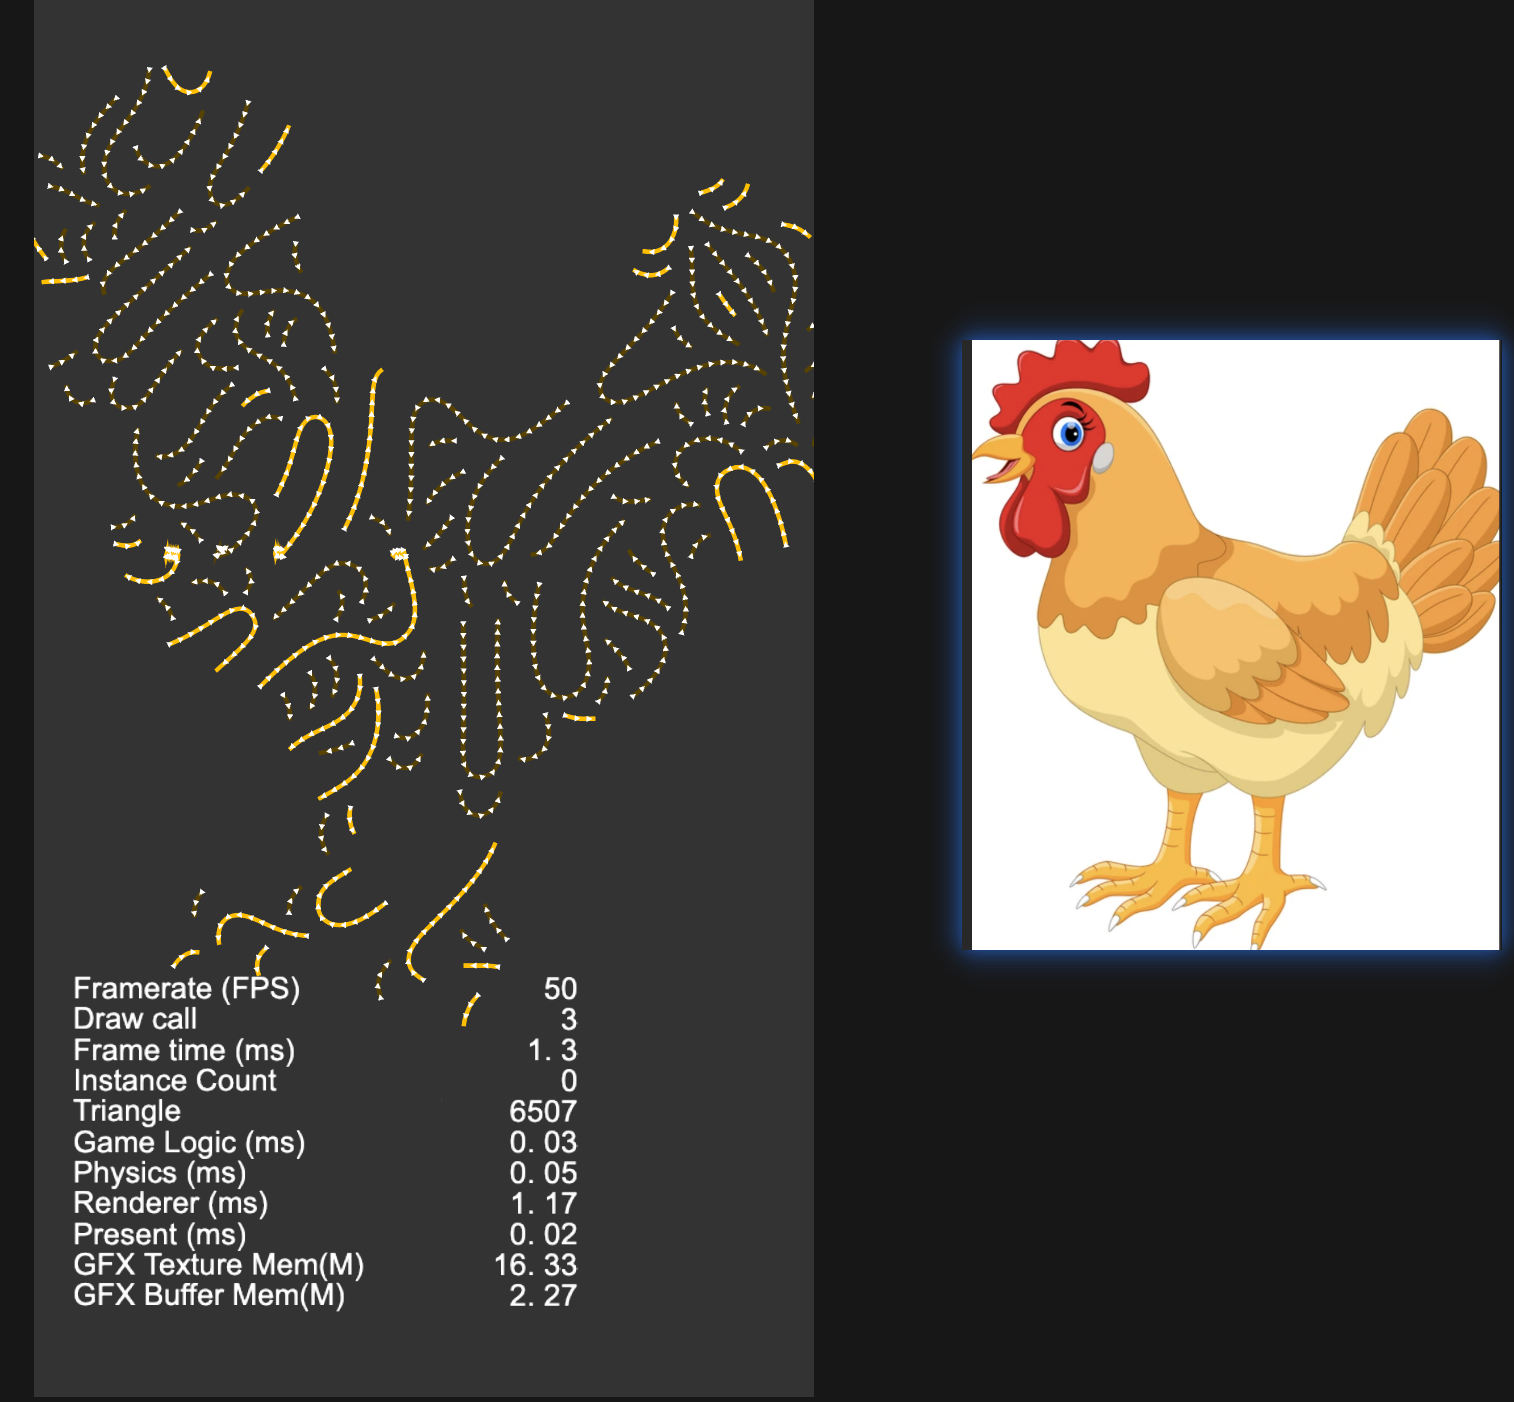
用GPT写的python脚本,python读入图片,进行计算,生成曲线的json信息,Canvas根据json绘制。。。
import micropip
await micropip.install(["pillow", "numpy"])

from PIL import Image, ImageDraw
import numpy as np
import math
import random
import json

# ======================
# 配置
# ======================

IMG_PATH = "duck.png"          # 输入图片
OUT_JSON = "duck_curves.json"
OUT_PREVIEW = "duck_curves_preview.png"

LINE_COLOR = "#ffbf00"
BG_COLOR = (30, 30, 30, 255)

STEP = 4                      # 曲线采样步长
MIN_DIST = 11                 # 曲线之间最小距离
MAX_POINTS = 45               # 单条曲线最大点数
TRY_COUNT = 6000              # 尝试生成次数
MIN_POINTS = 8                # 太短的曲线丢弃

LINE_WIDTH = 6
ARROW_SIZE = 13


# ======================
# 读取图片并生成 mask
# ======================

img = Image.open(IMG_PATH).convert("RGBA")
w, h = img.size
arr = np.array(img)

alpha = arr[:, :, 3]
rgb = arr[:, :, :3]

# 优先使用透明度作为形状
if alpha.max() > alpha.min():
    mask = alpha > 20
else:
    # 没透明通道时,默认认为非白色区域是鸭子
    brightness = rgb.mean(axis=2)
    mask = brightness < 245

occupied = np.zeros((h, w), dtype=np.uint8)


# ======================
# 工具函数
# ======================

def inside(x, y):
    ix = int(round(x))
    iy = int(round(y))
    return 0 <= ix < w and 0 <= iy < h and mask[iy, ix]


def too_close(x, y):
    ix = int(round(x))
    iy = int(round(y))
    r = MIN_DIST

    x0 = max(0, ix - r)
    x1 = min(w, ix + r + 1)
    y0 = max(0, iy - r)
    y1 = min(h, iy + r + 1)

    return occupied[y0:y1, x0:x1].any()


def mark_curve(points):
    for x, y in points:
        ix = int(round(x))
        iy = int(round(y))
        r = MIN_DIST // 2

        x0 = max(0, ix - r)
        x1 = min(w, ix + r + 1)
        y0 = max(0, iy - r)
        y1 = min(h, iy + r + 1)

        occupied[y0:y1, x0:x1] = 255


def angle_field(x, y):
    """
    不使用 noise 库的伪 Flow Field。
    由多个 sin/cos 叠加产生连续方向场。
    """
    nx = x / w
    ny = y / h

    a = (
        math.sin(nx * 12.0 + ny * 4.0) * 1.2 +
        math.cos(ny * 10.0 - nx * 3.0) * 1.1 +
        math.sin((nx + ny) * 8.0) * 0.8
    )

    # 让整体曲线更像旋涡/涡流
    cx = nx - 0.5
    cy = ny - 0.5
    swirl = math.atan2(cy, cx)

    return a * math.pi + swirl * 0.45


def trace_from(seed_x, seed_y, direction):
    points = []
    x = seed_x
    y = seed_y

    for _ in range(MAX_POINTS):
        if not inside(x, y):
            break

        if too_close(x, y):
            break

        points.append((x, y))

        a = angle_field(x, y)
        x += math.cos(a) * STEP * direction
        y += math.sin(a) * STEP * direction

    return points


def smooth_curve(points, iterations=2):
    """
    Chaikin 平滑,让折线变成更柔和的曲线。
    """
    if len(points) < 3:
        return points

    pts = points

    for _ in range(iterations):
        new_pts = [pts[0]]

        for i in range(len(pts) - 1):
            x0, y0 = pts[i]
            x1, y1 = pts[i + 1]

            q = (x0 * 0.75 + x1 * 0.25, y0 * 0.75 + y1 * 0.25)
            r = (x0 * 0.25 + x1 * 0.75, y0 * 0.25 + y1 * 0.75)

            new_pts.append(q)
            new_pts.append(r)

        new_pts.append(pts[-1])
        pts = new_pts

    return pts


def draw_arrow(draw, p1, p2, color):
    x1, y1 = p1
    x2, y2 = p2

    angle = math.atan2(y2 - y1, x2 - x1)

    left = (
        x2 - ARROW_SIZE * math.cos(angle - math.pi / 6),
        y2 - ARROW_SIZE * math.sin(angle - math.pi / 6)
    )

    right = (
        x2 - ARROW_SIZE * math.cos(angle + math.pi / 6),
        y2 - ARROW_SIZE * math.sin(angle + math.pi / 6)
    )

    draw.polygon([p2, left, right], fill=color)


# ======================
# 生成曲线
# ======================

curves = []

ys, xs = np.where(mask)
valid_pixels = list(zip(xs, ys))

for _ in range(TRY_COUNT):
    if not valid_pixels:
        break

    seed_x, seed_y = random.choice(valid_pixels)

    if too_close(seed_x, seed_y):
        continue

    forward = trace_from(seed_x, seed_y, 1)
    backward = trace_from(seed_x, seed_y, -1)

    points = list(reversed(backward)) + forward[1:]

    if len(points) < MIN_POINTS:
        continue

    points = smooth_curve(points, iterations=2)

    # 平滑后再检查是否大部分仍在 mask 内
    inside_count = sum(1 for x, y in points if inside(x, y))
    if inside_count / len(points) < 0.92:
        continue

    mark_curve(points)

    curve = {
        "id": len(curves),
        "color": LINE_COLOR,
        "width": LINE_WIDTH,
        "arrow": True,
        "points": [
            {
                "x": round(float(x), 2),
                "y": round(float(y), 2)
            }
            for x, y in points
        ]
    }

    curves.append(curve)


# ======================
# 输出 JSON
# ======================

data = {
    "width": w,
    "height": h,
    "curves": curves
}

with open(OUT_JSON, "w", encoding="utf-8") as f:
    json.dump(data, f, ensure_ascii=False, indent=2)


# ======================
# 绘制预览图
# ======================

preview = Image.new("RGBA", (w, h), BG_COLOR)
draw = ImageDraw.Draw(preview)

for curve in curves:
    pts = [(p["x"], p["y"]) for p in curve["points"]]

    if len(pts) >= 2:
        draw.line(
            pts,
            fill=curve["color"],
            width=curve["width"],
            joint="curve"
        )

        # 箭头画在末尾
        draw_arrow(draw, pts[-3], pts[-1], curve["color"])

preview.save(OUT_PREVIEW)

print("生成完成")
print("曲线数量:", len(curves))
print("JSON:", OUT_JSON)
print("预览图:", OUT_PREVIEW)
https://toolshu.com/python3
用这个网站直接在线运行python,pycharm居然1个G,等下载好,ai已经把解析json的cocos代码都搞好了。
你都怎么问的ai啊。 